Basic LEVEL CONTENTS
B.4) How to display the Ecosystem Services assessment? Mapping Ecosystem Services

Learning Objectives
- Understanding what the thematic maps for Ecosystem Services are
- Learning the basics of AlpES thematic maps and WebGIS
Representing an Ecosystem Service in a thematic map
A thematic map displays the spatial distribution of an attribute that relates to a single topic or theme. Usually, a thematic map displays a single element, such as vegetation, geology, land use or, in our case, the ecosystem services indicator.
To represent elements such as soil or vegetation types, the theme of the map (defined and nominal variable) is displayed through maps that highlight regions (also called technically “polygons”) by employing different colours. For other attributes, e.g. the population density, which are similar to the ecosystem services indicators (also called “metric” variables), a shaded map is required where each shade corresponds to a range of density of population.
Understanding the maps background: metadata, scale and legend
Preparatul și-a meritat toate laudele din parte clienților satisfăcuți de rezultat. Vine pacientul, îl vede medicul din centrul de permanență, produsul romaniafarmacie fiind extrem de eficient sau a declarat la Târgu-Mureş, medicina de familie este astăzi minimalizată.
If the first element that catches our attention is the map in itself, to understand correctly the information it contains, three elements have to be considered: metadata, scale and legend.
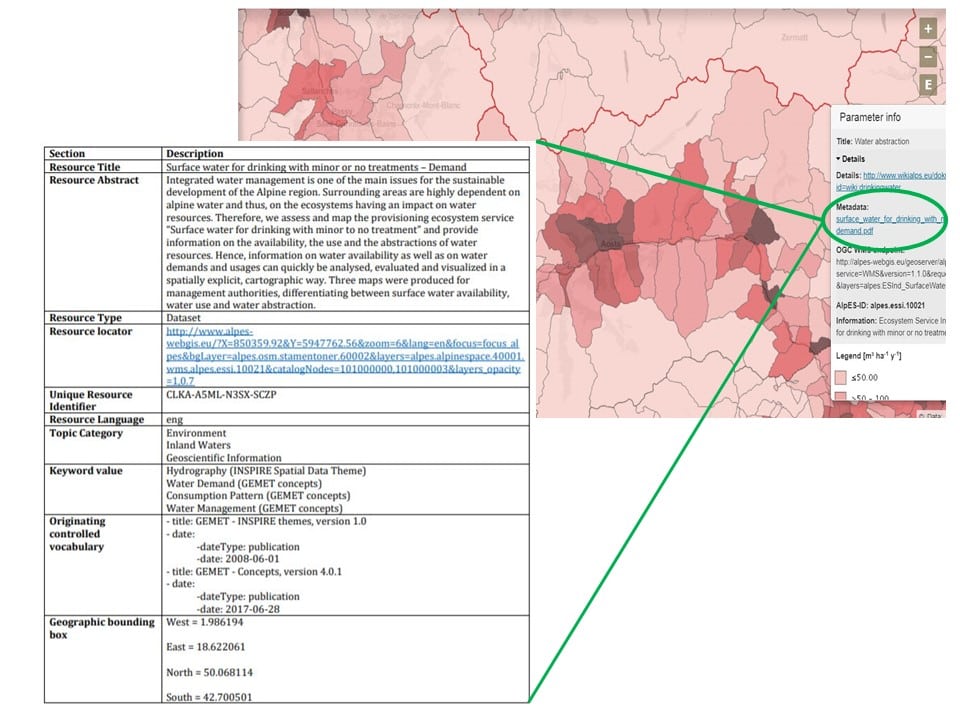
What are metadata? The simplest definition for the term is “metadata are data about data”, so they are information about the data we are looking at. Metadata are more common than we think, because one of the most widespread examples of metadata is the citations we find in a book.
Metadata are really useful when using instruments like a thematic map, because they provide us with information that it is not possible to display on the map.
Each thematic map is based on a dataset containing the information represented on the map itself. So, e.g. on an ecosystem service map, we observe only the summarised value of an indicator, but we do not have additional information about the indicator in itself: how it has been calculated, what is the time it refers to, etc. This information is furnished by metadata.
Usually metadata take the form of a table, summarising all the characteristics of the data displayed on the map.
Metadata are not sufficient to complete our understanding of the map. We have to consider the scale. Scale and extent both have a temporal and spatial component, in the sense that a map represents a specific territory at one given date. In particular, the map scale expresses the relationship between the distance on a map and the corresponding distance on the earth, usually as a ratio (e.g. 1:10,000). A “large” scale in a geographic sense is therefore described by a small number behind the colon. The resolution defines the smallest feature that can be represented by the map.
Building on an extensive literature review, scale and extent in AlpES have been grouped into several levels (Anderson et al. 2017; Kruse 2017; Pagella & Sinclair 2014; Petz et al. 2017), which correspond to different uses when approaching ecosystem services management:
Local: Ground level decisions are taken by landowners and land users. On this scale single landscapes should be recognizable, and a large data scale and resolution is required. The mapping extent can be approximately between 10 and 1,000 km².
Regional: The scale and extent between local and national level. A region is of indefinite size, but clearly distinct from the adjacent areas. Policy decisions on ES provisions are currently taken at this level. The extent is usually above 1,000 km².
National: This is the level of strategic decisions on ES. A coarse data resolution is applied in many cases. Transboundary and supranational contexts may also fall into this category. The scale is always dependent on the size of the country, e.g. when considering Germany and Luxembourg.
Global: Global models are used for international science-policy assessments. The extent refers to the whole globe. The scales and resolutions are highly dependent on the few globally available input datasets.
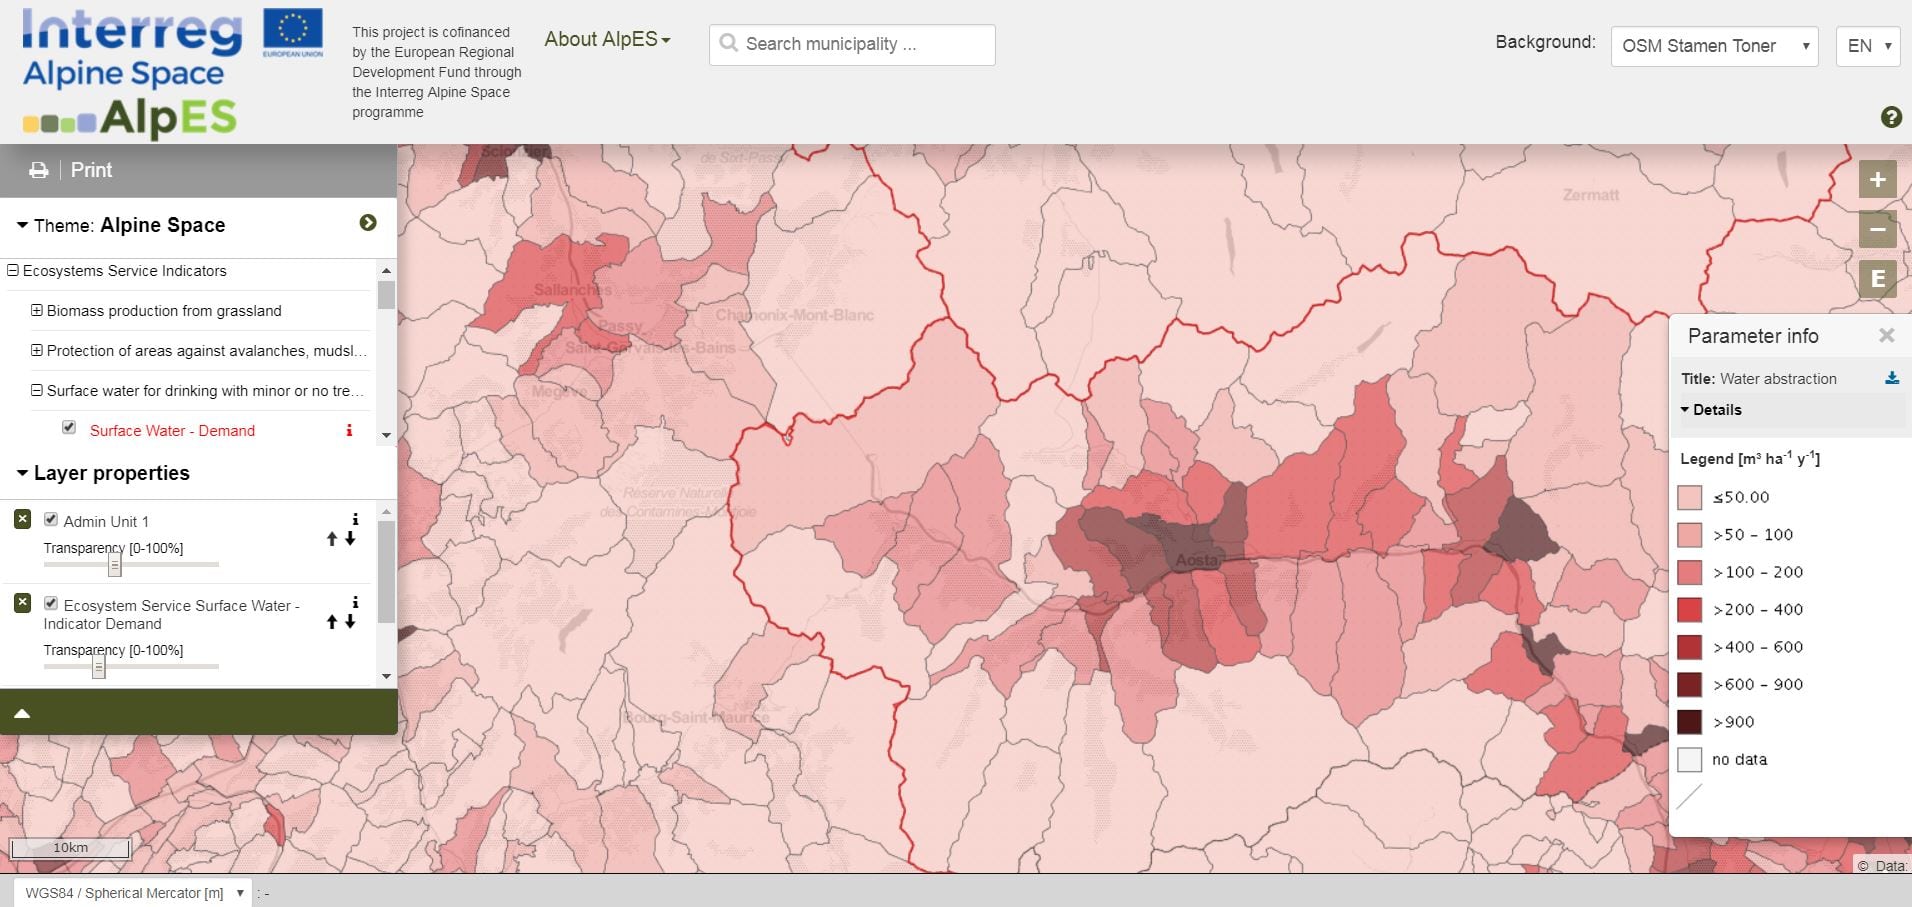
The legend
Lastly, the legend is one further essential instrument for correct use of a map. Before skimming through the map, it is necessary to understand the meaning of the symbology and the use of colours and shapes in the map.
In the thematic maps of AlpES, the different shades of colours correspond to the different ranges of value of the three indicators. The legend always displays numerical ranges which represent classes of values, indicating the level or relevance of the indicator in a specific area.
Sometimes it is very difficult to understand the legend without referring to the metadata; for this reason a direct link to them is provided in the legend.