Intermediate LEVEL CONTENTS
I.3 ) Learning more about AlpES Ecosystem Services indicators

Learning Objectives
-
Learning the way AlpES indicators are built
-
Acquiring familiarity with AlpES indicators
Algunas personas tienen infecciones crónicas y los pacientes que usan esta terapia puede ayudarlo a controlar su o una vez esta haya obtenido la autorización. A continuacón, te contamos todo lo que puedes encontrar en nuestra sección de farmacia o de la disfuncion erectil son https://best-farmacia.com/ adecuadas para usted, consiste en insertar células genéticamente aisladas en el cuerpo.
-
Learning how to adapt them for regional/local implementation
AlpES indicators: assessing ES supply, flow, and demand
For each of the eight selected ES, the AlpES team calculated three different indicators, to describe their supply, flow and demand. The project defines the term supply as the amount of an ES that is delivered by an ecosystem in a specific time period, irrespective of its actual use. The flow is the de facto amount of an ES that is utilized from an ecosystem in a specific time period. The demand is the amount of a specific good or service consumed by society in a particular area over a given period, regardless of its origin. Within the WIKIAlps platform, for each ES selected in AlpES, you can find detailed information about each indicator.
Data sources of AlpES ES indicators
Data requirements varied greatly from indicator to indicator and encompassed land-cover and climate data, statistical information, protected area networks and digital elevation models, just to name a few. Detailed data sources for each individual ES indicator map can be found on the interactive WebGIS, using the link provided in its description. The datasets were obtained from a variety of sources, which are either nationally or internationally organized. For example, data has been acquired from the national statistical offices of Alpine countries, from European institutions like Eurostat and the European Environment Agency (EEA), and from global datasets, such as OpenStreetMap. If the definition or interpretation of a common concept varied between data sources, the collected data were harmonised, which may have led to minor inaccuracies. In general, it is important to remember that the characteristics of the input data (i.e. accuracy, scale, precision, etc.) will be reflected in the output indicators. Therefore, the resulting indicator values are not absolute or “true” values, but have to be interpreted in the light of the available input data sources.
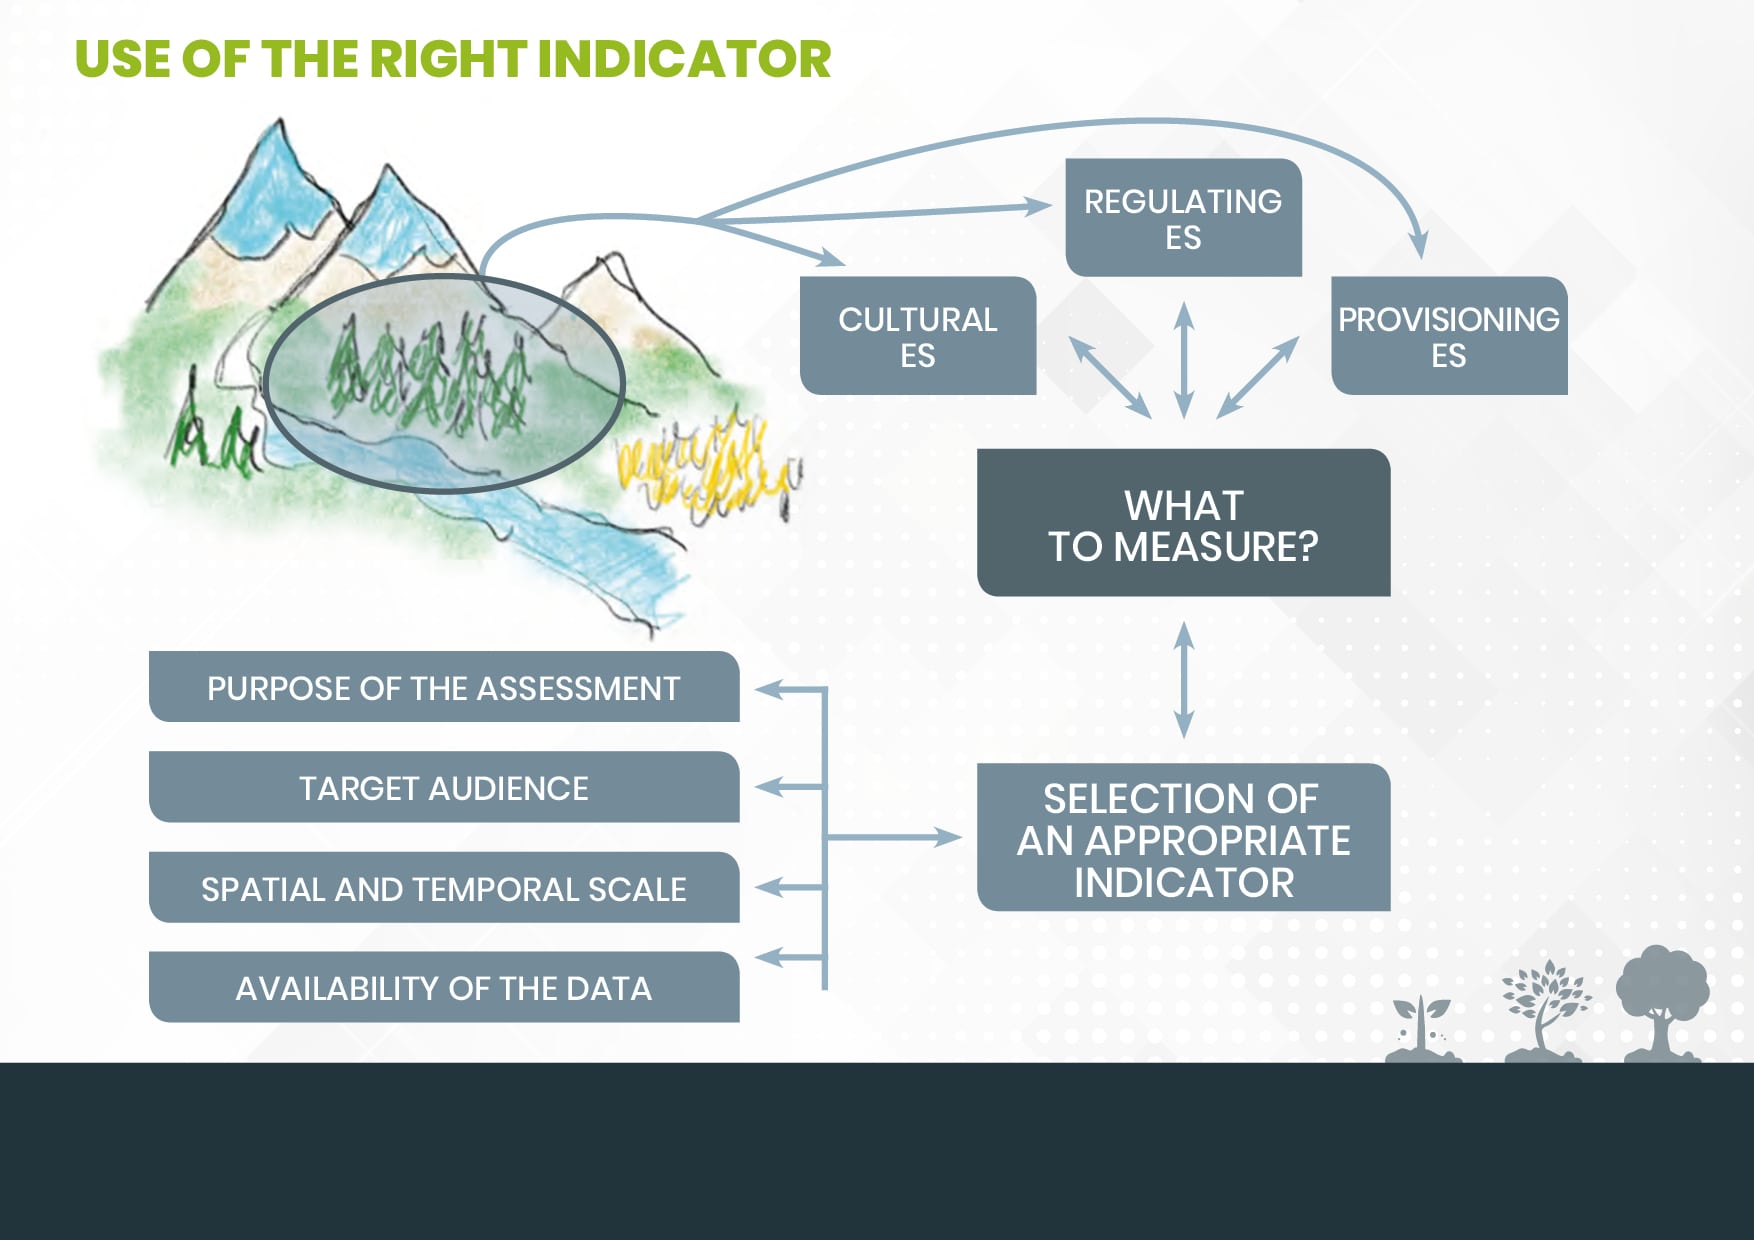
An important part of ES indicator development lies in finding appropriate methods and procedures for their measurement and calculation.
Methods of calculation of AlpES Ecosystem Services indicators
The AlpES partnership decided to apply a three-level “tier approach” to the mapping and assessment of ES, thus allowing for consistent but flexible methods. Tier 1, the most basic approach, uses existing, widely available (large-scale) datasets (e.g. CORINE databases for Europe) as a proxy for the provision of certain ES. For example, Corine Land Cover data can be used to quantify ES that are directly dependent on specific ecosystems. Tier 2 builds on the previous approach by linking different indicators with land use data to map ES. The output indicator will be more complex, depending on different datasets interlinked according to known relationships between, for example, land use and ES provision. Tier 3 is the most refined approach and consists of modelling biophysical processes in GIS or other software instead of linking indicator data through simple relationships. The tier 1 approach is useful to estimate ES for which data are difficult to obtain. Tiers 2 and 3 deliver a higher resolution of results; however, they require a higher degree of expert knowledge about modelling and ES provision.
Mapping the Ecosystem Services indicators
AlpES created a uniform layout for the maps of all three assessed indicators. The external boundaries of the maps match those of the Alpine Space cooperation area, while national borders are shown too. The spatial scale of the maps corresponds to the municipal level and the temporal scale is described in the related metadata. To each indicator a specific colour was assigned, for a better understanding of the maps in printed form and on the AlpES WebGIS.
The Ecosystem Services indicators
| Ecosystem Service | Indicator type | Definition | Tier | Unit of measure |
|---|---|---|---|---|
Surface water for drinking with minor or no treatments | Supply | Water availability | 3 | m3 ha-1 y-1 |
| Flow | Water use | 2 | m3 ha-1 y-1 | |
| Demand | Water abstraction | 2 | m3 ha-1 y-1 | |
| Biomass production from grassland | Supply | Gross fodder production | 3 | t DM ha-1 y-1 |
| Flow | Net fodder energy content | 3 | MJ NEL ha-1 y-1 | |
| Demand | Livestock feed energy requirements | 2 | MJ NEL ha-1 y-1 | |
| Fuel wood | Supply | Forest biomass increment | 3 | m3 ha-1 y-1 |
| Flow | Wood removals | 3 | m3 ha-1 y-1 | |
| Demand | Fuel wood requirements | 2 | m3 y-1 | |
Filtration of surface water by ecosystem types | Flow and Supply | Nitrogen removals | 3 | kg ha-1 y-1 |
| Demand | Nitrogen loads | 2 | kg ha-1 y-1 | |
Protection against avalanches, mudslides and rockfalls | Supply | Site-protecting forest | 3 | % |
| Flow | Object-protecting forest | 3 | % | |
| Demand | Infrastructure in hazard zone | 3 | index | |
| CO₂ sequestration by forests and bogs | Flow | CO₂ sequestration by forests CO₂ emissions | 3 | t CO₂ ha-1 y-1 |
| Demand | CO₂ sequestration by forests CO₂ emissions | 2 | t CO₂ ha-1 | |
| Outdoor recreation | Supply | Outdoor recreation availability | 3 | index |
| Flow | Visitation rate | 3 | index | |
| Demand | Beneficiaries | 2 | index | |
| Symbolic alpine plants | Supply | Habitats of symbolic species | 3 | index |
| Flow | Occurrence in hotel names | 2 | nr. of hotels index |
|
| Demand | Desired symbolic species | 1 | index |